As people around the world wait out the COVID-19 pandemic, many are noticing a dramatic decrease in pollution levels and an increase in air quality.
Unfortunately, the improvements have come at a very high cost, as billions of people around the world are either on lockdown or sheltering-in-place. However, the observed rapid changes in air quality have been extraordinary across the globe.
In Dehli, India, residents have seen clear skies for the first time in years, as the city experiences its freshest air in decades.
Before a nationwide lockdown, the Indian city known for its murky skies would regularly experience air quality index (AQI) levels above 200. An AQI above 25 is considered unsafe by the World Health Organization.
However, with millions of cars off the roads and factories at a halt, the AQI in Dehli has regularly fallen below 20.
The air quality improvement in Dehli, and in most cities around the world, is driven by a reduction in nitrogen dioxide (NO2). The common pollutant is primarily emitted from burning fossil fuels, like diesel, gasoline, or coal. So, changes in NO2 levels can usually be used as an indicator of changes in human activity, according to NASA.
You can see the sizable difference in pollution in major U.S. cities for yourself on satellite imagery. The image below shows the mean March NO2 levels through the I-95 corridor from 2015 through 2019.
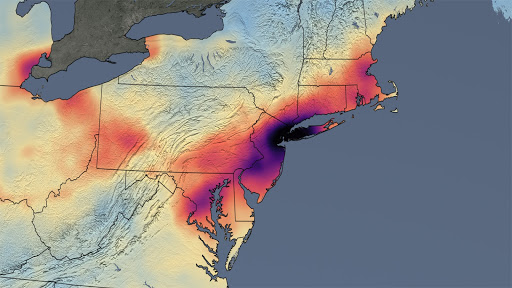 March NO2 levels through the I-95 corridor from 2015 through 2019.
Now, compare that image with nitrogen dioxide levels in the same region for March 2020 below.
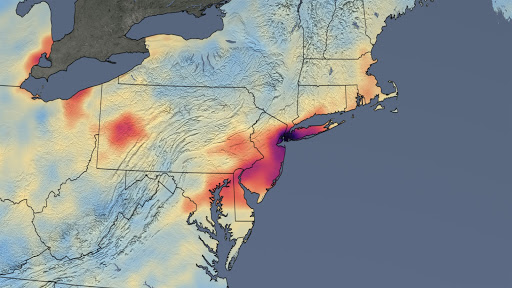 March 2020 NO2 levels through the I-95 corridor
Data indicate the NO2 levels in March 2020 are nearly 30% lower on average across the northeast region (from Washington, D.C. to Boston) compared to the mean of 2015 to 2019.
There’s been a similar drop in air pollution closer to home. The main air quality monitor in Indianapolis shows a 38% decline in daily average nitrogen dioxide levels.
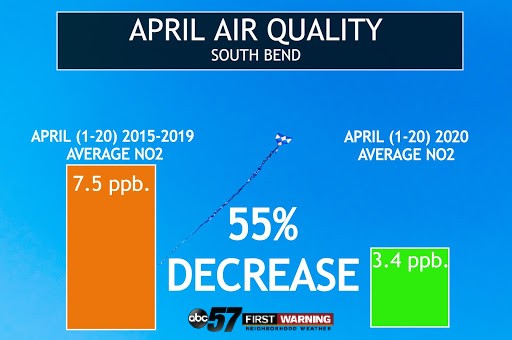
Additionally, in South Bend, the drop in NO2 levels has been even more precipitous.
Using data from the Shields Drive monitor, I compared nitrogen dioxide levels from April 1-20 since 2015. I then took the data from April 1-20, 2015 through April 1-20, 2019 and averaged it together to get South Bend’s mean NO2 levels for the first two-thirds of April, which came out to 7.5 ppb (parts per billion).
This year, South Bend’s average daily NO2 level for the same time period was 3.4 ppb, a decrease of more than 50 percent.