We’ve all felt the hot and dry conditions around Michiana this month – but just how hot and dry is it compared to normal?
Rainfall totals in South Bend this June have been relatively low, about 1" below normal (we should be receive around 2.91" of rain by June 21, but we have only had 1.94" so far this month).
The normal high temperature for June is 70.3°, but this year, the average high at this point in the month sits at 82.3°. In fact, we’ve only seen 2 days below 75°, and less than half of the days so far this June have been below 80°.
Don’t put your watering can away! Conditions have been abnormally dry, and there is a lack of significant rainfall through the 10-day forecast.
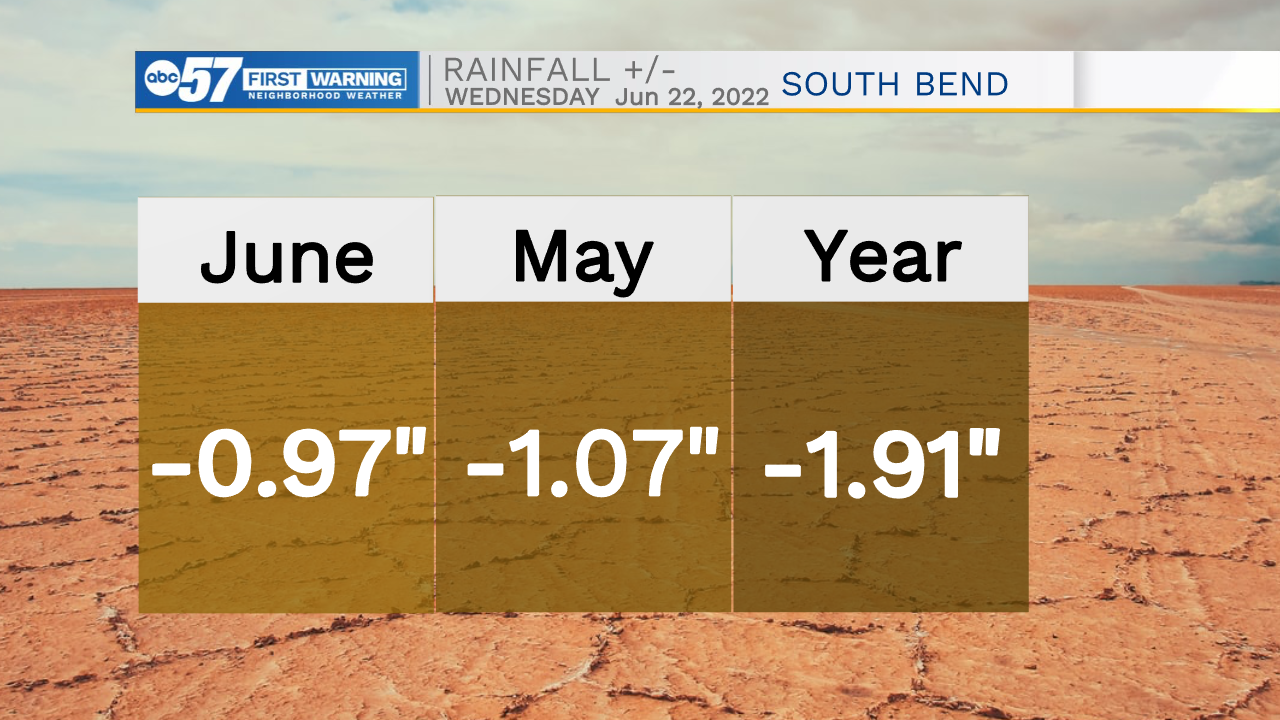
Rainfall amounts in the last 30 days across Michiana have been relatively low, about 0.5” below what we would expect to see during that stretch of time. South Bend specifically has seen just under 1” less than average in June so far, and just over 1” less in May.
Relatively dry conditions have been around for the entire year, with rainfall totals nearly 2” below where they should be by now in 2022. While this number might seem high, typically by June 21, we should have around 18" of rain for the entire year, but we've only picked up around 16" of rain this year.
Yesterday was the first day of summer, but also the hottest day we’ve had here in South Bend since 2012 with high temperatures climbing up to 99°!
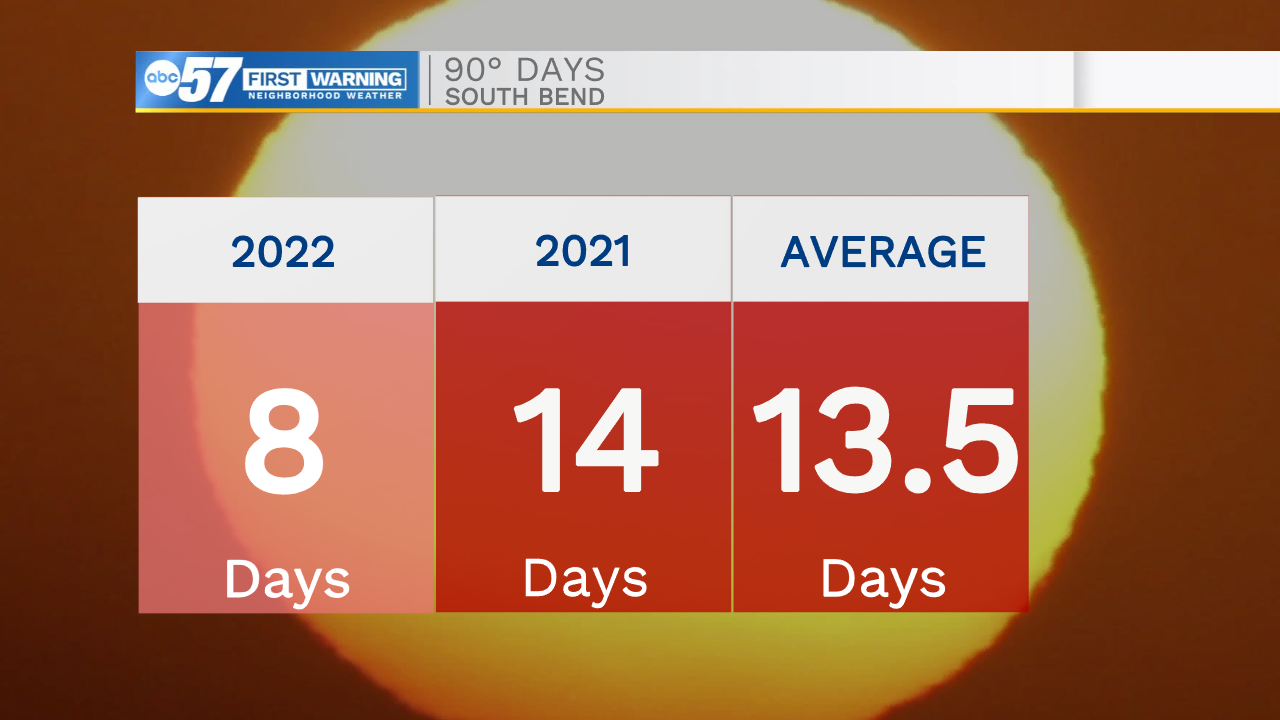
This year in general has been quite warm compared to normal. South Bend has already had 8 days with temperatures at or above 90°, and with 2 more 90° days in the 10-day forecast, it’s likely we’ll reach ten 90°+ days before the end of the month.
Both Friday and Saturday are looking to be toasty with high temperatures in the 90s. The average number of days at or above 90° annually is 13.5, so if we reach 10 of these scorching days after this weekend, we’ll be only 4 hot days away from beating the average - and only halfway through the year and a couple days into summer.
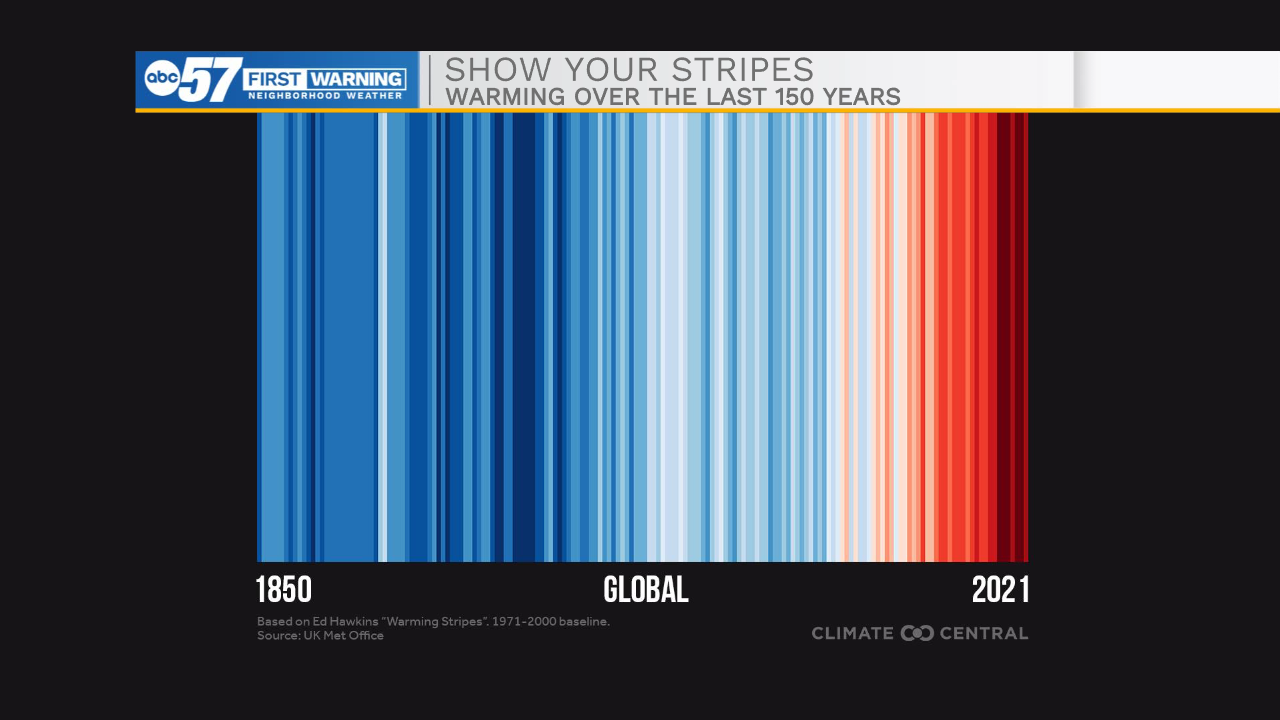
Yesterday was also Show Yours Stripes Day, a day used to reflect on how the climate has changed over the years - very fitting with how hot yesterday’s high temperatures got.
In the graph below, blue bars represent years with below-average annual temperatures, and red bars represent years with above-average annual temperatures.
More red bars have been popping up in recent years (on the right of the chart), showing our warming climate in a more visual way.
With just a few small lifestyle changes, like shopping with sustainable businesses and being more energy conscious, each of us can help to slow climate change.