When coronavirus numbers start piling up, it gets to be a little overwhelming. I spoke with an infectious disease expert about trials of tracking this data, how she plucks insight from it, and what we need to look for over the next year.
“I’m an infectious disease modeler, that is to say I take data driven analysis and build mathematical models to try and understand as to why a disease is emerging in a population and how it might develop over time," said Ana Isabel Bento, an assistant professor in the School of Public Health at Indiana University, Bloomington.
She has worked with all sorts of diseases, from the flu to Ebola. When the pandemic started, it was all hands on deck for researchers like her at Indiana University and around the world.
In the beginning, we were all just counting the total number of cases, but the total number of cases can only provide us with so much information.
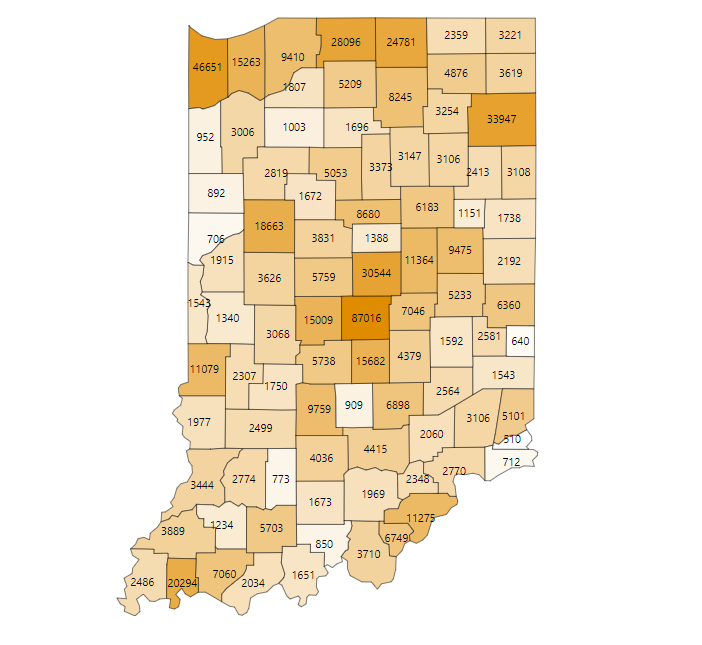 Number of cases by county
“Just reporting cases becomes a little bit challenging because it does give the false impression that some places are doing better than others," Bento said.
It didn’t tell us much, other than that the virus was still active, and still spreading.
If you followed any COVID-19 dashboard over the last year, you’ve probably noticed changes almost everywhere you look, including changes in how much data is provided to the public.
Officials started tacking on other datasets, like rolling averages and positivity rates.
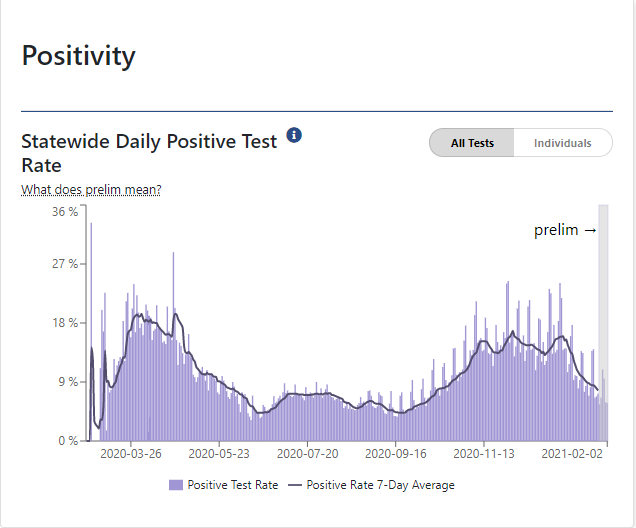
The Indiana COVID Dashboard is a good example of this.
"If we’re just looking at the number of cases we can’t really compare population A with population B. If in population A we are testing way more people than population B, we might be assuming population B has fewer cases, when in fact you’re not looking as well or as thoroughly," Bento said.
The more data scientists have, the more confidence they have in the direction the pandemic is going. With vaccines now going into arms across the country, now is not the time to stop testing, we need more data.
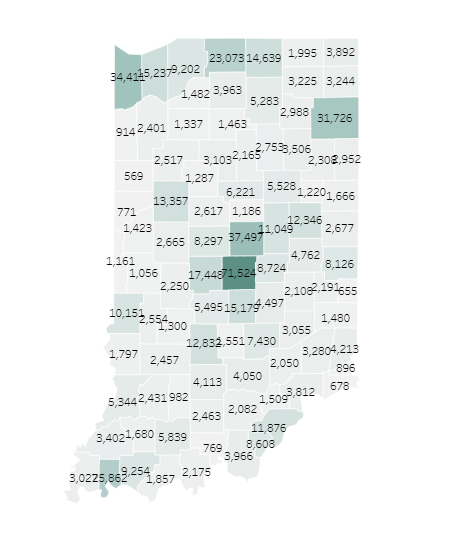 Vaccine distribution by county 02/03/21
"Vaccines and tests actually go hand-in-hand," Bento said. "We know that vaccines are effective from the clinical trials, at the individual level. However, we’re still trying to understand what are the effects of the vaccine at the population level."
The vaccine will most likely protect you, the individual, from getting sick.
It’s 95 percent effective in clinical trials.
But we don’t know yet if the vaccine prevents you from passing the virus on to the greater population, which is why we still need more testing, even as we ramp-up vaccines.
"By then evaluating test positivity and vaccine coverage we’ll begin to understand measures of how effective the vaccine is at the population level," Bento said.
So, is the vaccine having an effect on the spread, already?
“It’s too early to tell. it will depend on how fast we get our population vaccinated," Bento said.
That’s why a commitment to continued testing is so important.
Even if you get the vaccine, you might need to be tested. You could be one of the very few (five percent), that the vaccine is ineffective.
More frequent testing and the development of a rapid at-home test would be a game changer.
"Because we want people to go back to work, safely for them and for others around them. Testing actually helps with decisions as to whether people should stay home or go back to work,' Bento said.
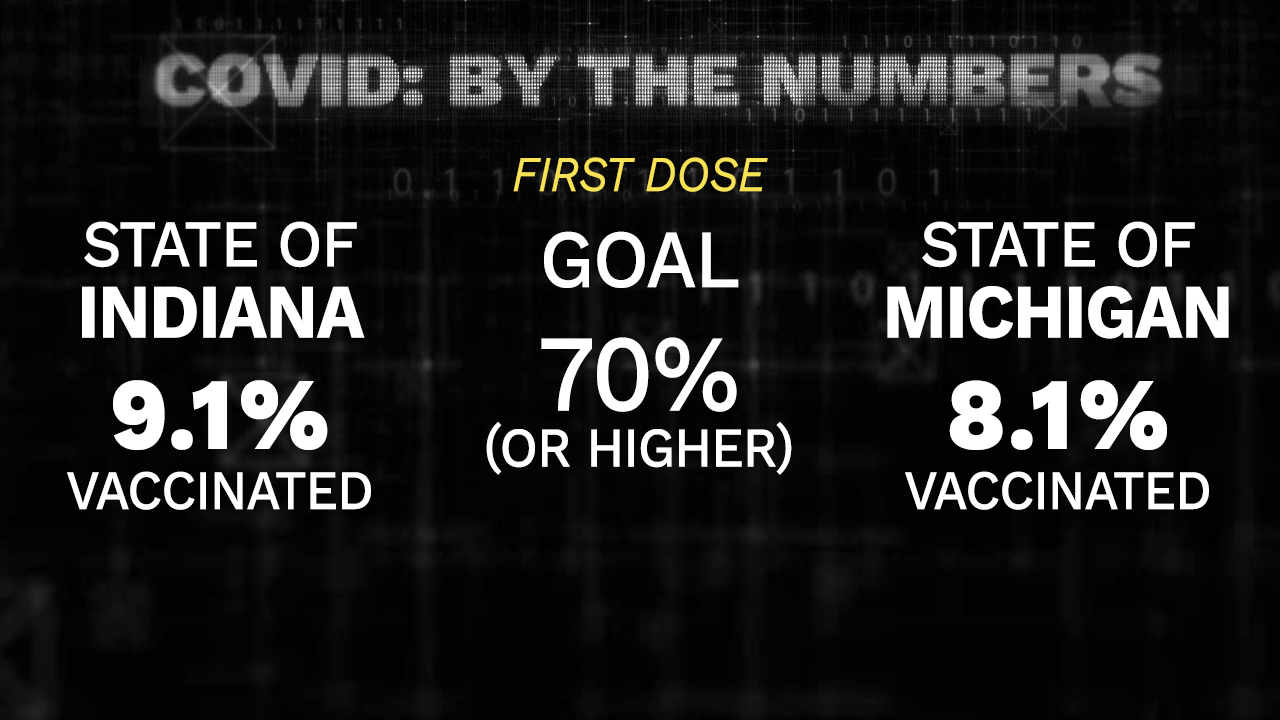
Bento said given the infection rate of COVID, the vaccination goal should be 70 percent or higher, to reach a herd immunity.
As of early February, both Indiana and Michigan have vaccinated roughly ten percent of the population.
The more people that are vaccinated, the more we’ll be able to say about it’s effectiveness in controlling the virus.